Molecular lines
Molecular opacities in stellar atmospheres become increasingly important at low temperatures, requiring a comprehensive list of transitions for a wide variety of molecules in modelling software. This page lists molecular data included in our PHOENIX setup alongside relevant literature references. Please communicate mistakes to romang@ucsd.edu.
| Identifier | Species | Source | Reference |
|---|---|---|---|
| AMES 41.3M lines |
H16OD | Ab initio calculations for heavy water by NASA Ames center. | Partridge+1997 |
| BT 505M lines |
H2O | Comprehensive list of water lines based on ab initio calculations by University College London. | Barber+2006 |
| KCD15 5.7M lines |
12C12C, 12C13C, 12C15N, 12CH, 13C13C, 13C15N, 13CH, 14NH, 15NH, 17OH, 28Si16O, 28Si18O, 28SiH, 29Si16O, 29SiH, 30Si16O, 30SiH, H2 | Compilation of diatomic molecular lines by Robert Kurucz calculated using rotational constants determined by fitting known energy levels. Originally released on CD-ROM #15. | Kurucz 1995 |
| CDSD 4.0M lines |
12C16O17O, 12C16O18O, 12C16O2, 12C18O2, 13C16O17O, 13C16O18O, 13C16O2 | Lines from Carbon Dioxide Spectroscopic Databank (CDSD) generated based on observed dipole moments. | Tashkun+2011 |
| CS_HITRAN 6.7K lines |
14NH3 | Ammonia lines provided by Christopher Sharp based on revised HITRAN database. | Sharp+2007 |
| DRA 267K lines |
90ZrO, 91ZrO, 92ZrO, 93ZrO, 94ZrO, 95ZrO, 96ZrO, YO | Zirconium and yttrium monoxide lines used in opacity calculations by David R Alexander and Jason Ferguson, based on measurements from Littleton+1985. | Ferguson+2005 |
| GOORVITCH 134K lines |
12C16O, 12C17O, 12C18O, 13C16O, 13C17O, 13C18O, 14C16O | Revised carbon monoxide lines for 7 isotopes by David Goorvitch based on electric dipoles calculated in Goorvitch+1994. | Goorvitch 1994 |
| HITRAN2004 1.3M lines |
12C12CH2, 12C12CH4, 12C12CH6, 12C13CH2, 12C13CH4, 12C16O19F2, 12CH316OH, 12CH335Cl, 12CH337Cl, 12CH3D, 14N14N, 14N14N16O, 14N14N17O, 14N14N18O, 14N15N16O, 14N16O, 14N16O2, 14N16O+, 14N18O, 14NH3, 15N14N16O, 15N16O, 15NH3, 16O12C32S, 16O12C33S, 16O12C34S, 16O13C32S, 16O16O, 16O16O17O, 16O16O18O, 16O17O, 16O17O16O, 16O18O, 16O18O16O, 16O3, 18O12C32S, 32S16O2, 32S19F6, 34S16O2, 35Cl16O, 37Cl16O, H127I, H12C14N, H12C15N, H12C16OOH, H13C14N, H14N16O3, H16O35Cl, H16O37Cl, H16O79Br, H16O81Br, H16O2, H17OD, H18OD, H19F, H35Cl, H37Cl, H79Br, H81Br, H212C16O, H212C18O, H213C16O, H216O2, H217O, H218O, H232S, H233S, H234S | Molecular lines from the High-Resolution Transmission Molecular Absorption Database (HITRAN) by Harvard-Smithsonian Center for Astrophysics, 2004 edition. | Rothman+2004 |
| HITRAN2008 31.2K lines |
12C17O18O, 13C18O2, 16OH, 18OH, 31PH3 | Molecular lines from the High-Resolution Transmission Molecular Absorption Database (HITRAN) by Harvard-Smithsonian Center for Astrophysics, 2008 edition. | Rothman 2008 |
| JOERGENSEN 2.2M lines |
12C14N, 13C14N | Cyanide lines calculated by Uffe Jørgensen based on a model fit to 10 000 observed frequencies from Berkeley Atlas of Molecular Spectra. | Jørgensen+1990 |
| LB_HITRAN 34.6K lines |
12CH4 | Experimental methane transitions provided by Linda Brown for HITRAN in P5 (icosad) vibrational polyad. | Brown 2005 |
| NT 3.1M lines |
H3+ | Ab initio calculations for trihydrogen cation by Liesl Neale and Jonathan Tennyson. | Neale+1995 |
| BERNATH 301K lines |
CrH , FeH , TiH | Calculated line lists for key molecules found in brown dwarf atmospheres, currently available through the MoLLIST (Molecular Line Lists, Intensities and Spectra) database. | Bernath 2020 |
| PHILLIP2 53.8K lines |
24MgH, 25MgH, 26MgH | Magnesium monohydride lines based on theoretical dipole moments adjusted for experimental data calculated to improve the accuracy of PHOENIX models at low temperatures. | Weck+2003 |
| PLEZ2004 14.6M lines |
40CaH, 46TiO, 47TiO, 48TiO, 49TiO, 50TiO, VO | Lines of selected diatomic molecules inherited from the line lists used by MARCS atmospheres provided by Bertrand Plez in private communication. | Plez 2008 |
| STDS 31.3M lines |
12CH4, 13CH4 | Methane lines generated using the Spherical Top Data System (STDS) by the PHOENIX collaboration. | Wenger+1998 |
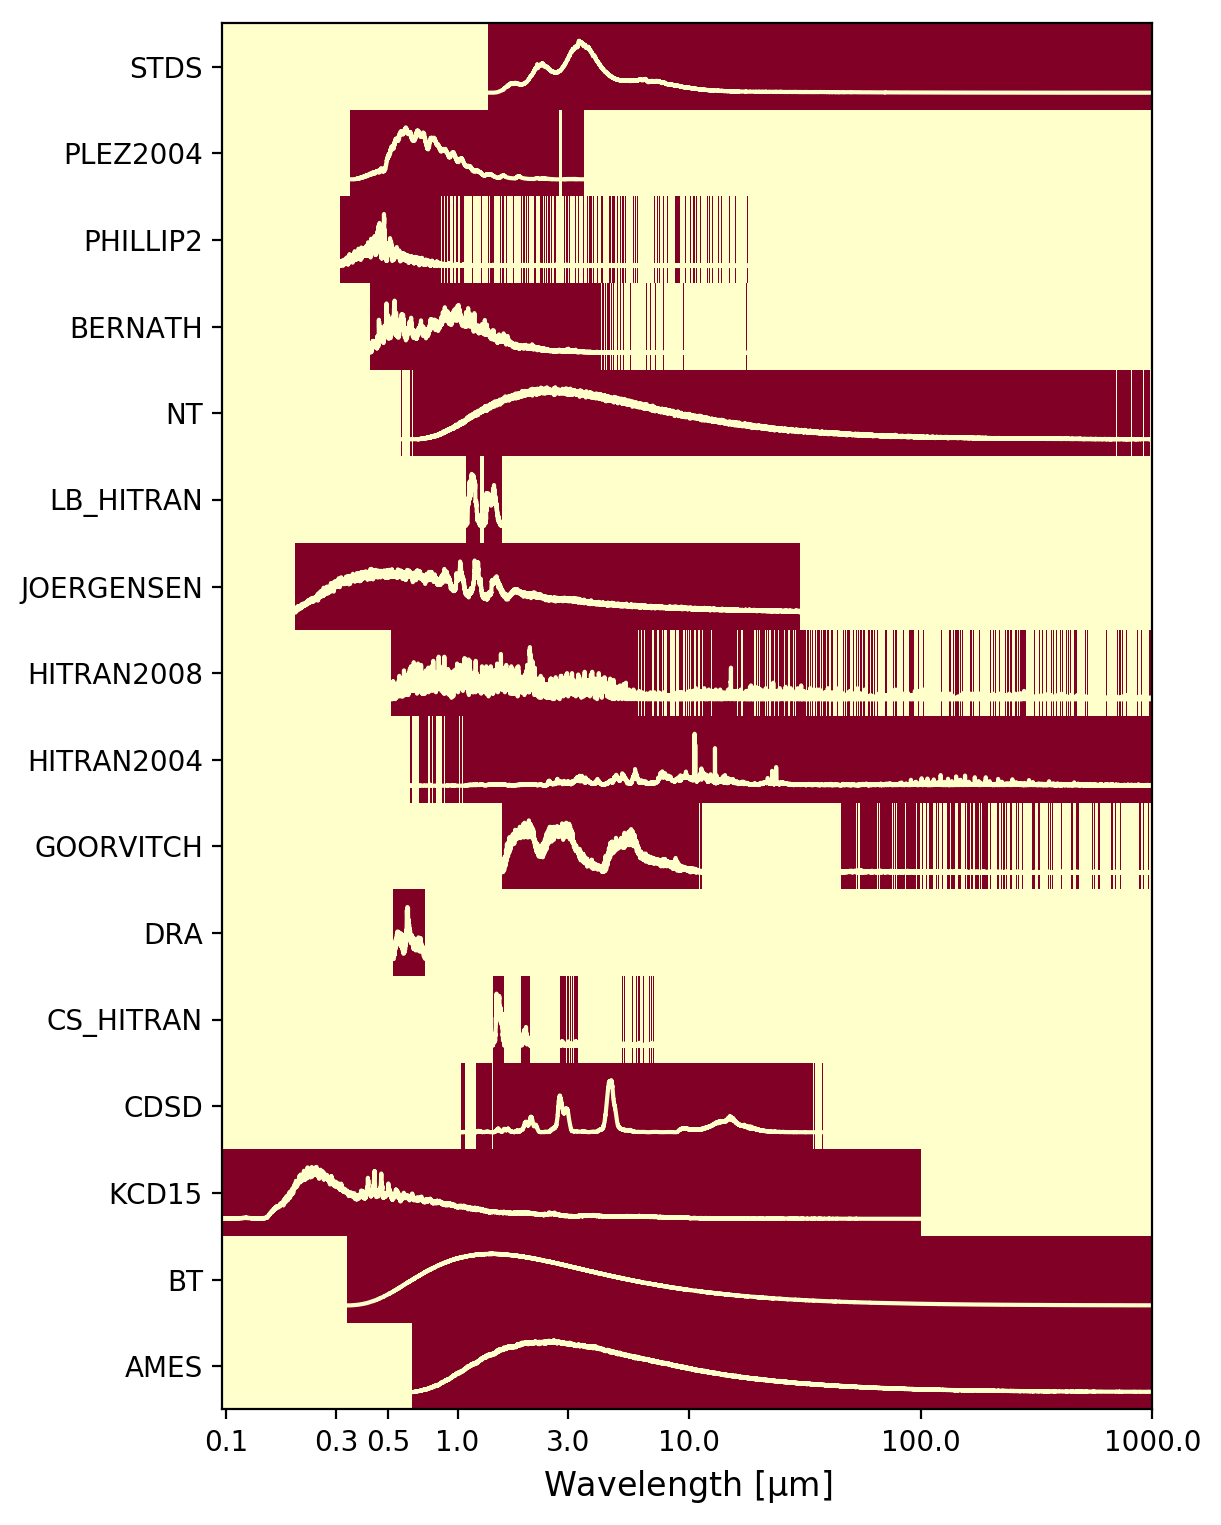
The diagram below visualizes the distribution of lines across the electromagnetic spectrum. Shaded in maroon are the regions with at least 0.0004 lines per log10(Å). The curves show the line density, normalized to the peak density of the identifier.